

In today’s digital-first world, especially for startups and tech companies user experience (UX) isn’t just a buzzword, it’s a make-or-break factor for success. But how do you know if your product’s UX is hitting the mark? The answer lies in UX metrics, a set of measurements that reveal how users interact with your product and feel about their experience. If you’re a UX manager, product leader, or startup founder, understanding and tracking these metrics can transform your product’s performance. Let’s dive into what UX metrics are, why they matter, and how you can implement them, before tying it all together with how tools like Trypp can make this process seamless.
What Are UX Metrics, Really?
At their core, UX metrics are tools to measure how users engage with your product or service, giving you insights into their experience. They come in two flavors: quantitative and qualitative, each offering unique perspectives.
Quantitative metrics are the numbers that tell the story of user behavior. Think about metrics like Task Success Rate (TSR), the percentage of users who complete a task successfully, calculated as (number of successful completions / total attempts) * 100. Other examples include time on task, error rate, conversion rate, bounce rate, session duration, pages per session, click-through rate (CTR), and scroll depth. These numbers reveal efficiency, engagement, and usability, helping you pinpoint where users struggle or thrive.
On the other hand, qualitative metrics capture the human side of the story, user feelings and opinions. Metrics like User Satisfaction Score (USS), typically rated on a 1-5 scale, or Net Promoter Score (NPS), which measures loyalty on a 0-10 scale (promoters minus detractors), give voice to user happiness. Customer Effort Score (CES), System Usability Scale (SUS), user interviews, and usability testing also fall here, offering rich insights into why users behave the way they do.
Together, these metrics paint a complete picture, blending hard data with personal feedback.
Why Tracking UX Metrics Is Non-Negotiable for Your Product
You might be thinking, “Why dive into all these numbers and user feedback, isn’t that just extra work?” Far from it. UX metrics, especially quantitative ones, are your crystal-clear window into the health of your user experience, providing a vital pulse check on how well your product performs in the real world. When measured in production, tracking real user workflows as they happen, these metrics become even more powerful, revealing the true state of your UX. I call it your product’s UX health. Here’s why they’re indispensable for driving your product’s success and keeping users engaged:
First, they help you identify pain points. If your error rate spikes or your TSR dips, it’s a red flag that users are stumbling over a feature, say, a confusing checkout process or a buggy navigation menu. Second, they boost user satisfaction. A low USS or NPS might signal frustration, prompting you to dig deeper into user interviews or surveys to uncover the “why.” Third, they drive data-driven decisions. Instead of guessing what changes to make, you can rely on metrics like conversion rate or session duration to guide your design tweaks.
Perhaps most importantly, UX metrics optimize the user journey, the path users take from first touch to final goal. For example, a high bounce rate on your landing page might mean it’s failing to communicate value, while a short session duration could indicate users can’t find what they need. By tracking metrics at each stage, you can smooth out drop-offs and enhance engagement.
Better UX doesn’t just delight users, it drives business outcomes. Studies show improved UX correlates with higher retention, engagement, and revenue, making these metrics a strategic priority for any product team.
How to Implement UX Metrics
So, how do you start tracking UX metrics effectively? Here’s a step-by-step approach to get you rolling:
Step 1: Define Your Goals
Begin by clarifying what you want to achieve. Are you aiming to boost user retention, increase task completion, or improve satisfaction? Your goals will shape which metrics you prioritize. For instance, if retention is the focus, look at NPS and session duration; for usability, focus on TSR and error rate.
Step 2: Pick the Right Metrics
Don’t try to track everything at once, start with a handful of key metrics that align with your goals. For a startup, you might begin with TSR, USS, and bounce rate, then expand as you grow. Balance quantitative (e.g., conversion rate) and qualitative (e.g., CES) metrics for a well-rounded view.
Step 3: Set Up Tracking Tools
To gather meaningful UX data, you’ll need the right technology tailored to your needs. Robust analytics platforms can track quantitative metrics, such as session duration and bounce rate, offering insights into user behavior over time. Visualization tools can uncover deeper patterns, like how far users scroll or where they click most frequently, shedding light on engagement and usability. For qualitative insights, you can leverage survey platforms to capture user feedback or conduct in-depth user interviews and usability tests to understand their experiences firsthand. Together, these approaches, supported by industry insights from experts, create a solid foundation for measuring and improving your product’s UX.
Step 4: Analyze the Data
Regularly review your metrics to spot trends and anomalies. Look for patterns, like a sudden drop in TSR coinciding with a new feature launch, or a rise in NPS after a design tweak. Pair quantitative data with qualitative insights, like high error rates paired with user complaints about a confusing interface to understand the full story.
Step 5: Iterate and Improve
Use your findings to make informed changes, then monitor the impact. Did fixing a navigation issue lower the error rate and boost TSR? Keep refining based on what works, ensuring continuous improvement. As Koru UX notes, consistency in tracking over time is key to catching issues early and maintaining momentum.
Navigating Challenges and Best Practices
Tracking UX metrics isn’t always straightforward. You might face data overload, where too many metrics cloud your focus, stick to a few critical ones to stay sane. Interpretation can also be tricky; numbers need context, so pair them with qualitative feedback to avoid missteps. And consistency matters, track regularly to identify trends, not just one-off spikes.
Best practices include setting baselines before making changes (e.g., baseline TSR before a redesign), setting clear targets (e.g., increase USS by 10%), and combining quantitative and qualitative data for a holistic view. This balanced approach ensures you’re not just chasing numbers but understanding user experiences deeply.
Bringing It All Together with Trypp
To gather meaningful UX data, you’ll need the right technology. Analytics platforms can track quantitative metrics like session duration and bounce rate, revealing user behavior, while visualization tools uncover patterns like scroll depth and clicks, shedding light on engagement. For qualitative insights, use surveys or user interviews to understand experiences. But traditional methods, sifting through recordings, heatmaps, or surveys, can feel slow and incomplete, missing the full story.
The truth is simple: users turn to your product to complete tasks, like buying a shirt or finding a setting, saving time, money, or effort. If your product makes that easy, it wins; if not, users leave. You need real-time insights into their tasks, not delayed reports or misleading metrics like page views—five minutes on a page could mean engagement or confusion.
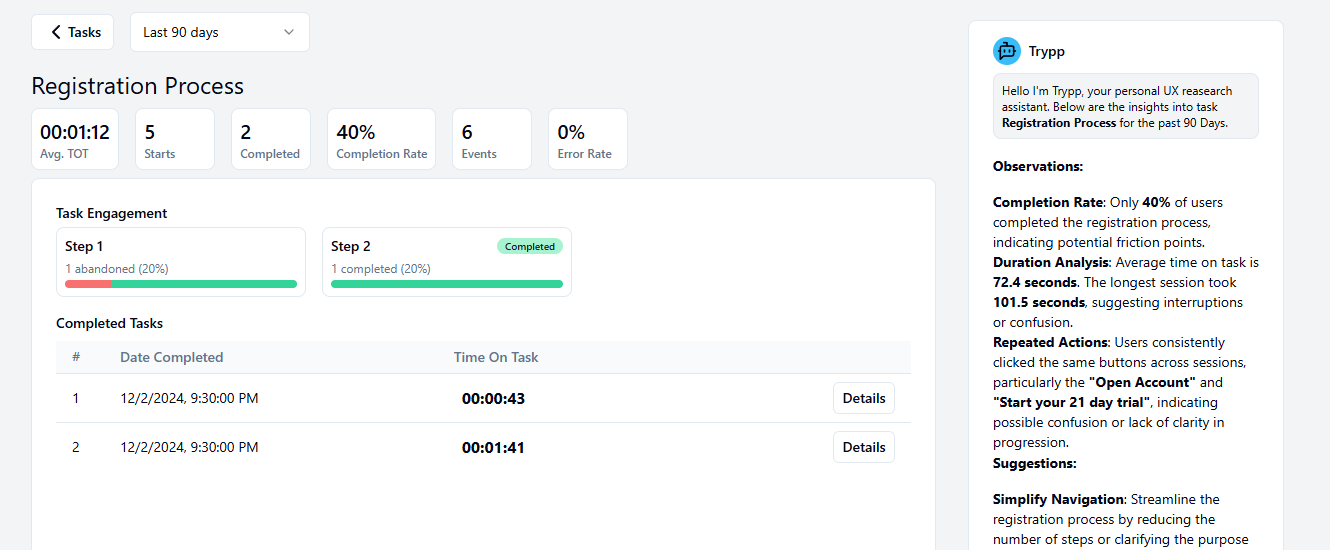
That’s where Trypp reimagines UX metrics. Our AI-powered platform tracks real user workflows in production, focusing on task-based metrics like Time on Task, error rates, and task completion. Imagine spotting a drop in Task Success Rate or a spike in errors instantly, with Trypp’s AI pinpointing issues and suggesting fixes, like simplifying a workflow, while blending data and feedback. It saves hours of manual work, perfect for small teams with tight budgets or no researchers, automating insights so you can focus on improving UX, not chasing data.
For product teams, UX managers, and startups, Trypp is the tool to elevate your UX metrics strategy.
Ready to transform your product’s user experience? Visit our website or start for free today to see how Trypp can help you track, analyze, and optimize UX metrics like never before.